(or How I implemented an unanswered question tracker and began to grasp the size of the site.)
I’m not sure when it happened, but Math.StackExchange is huge. I remember a distant time when you could, if you really wanted to, read all the traffic on the site. I wouldn’t recommend trying that anymore.
I didn’t realize just how vast MSE had become until I revisited a chatroom dedicated to answering old, unanswered questions, The Crusade of Answers. The users there especially like finding old, secretly answered questions that are still on the unanswered queue — either because the answers were never upvoted, or because the answer occurred in the comments. Why do they do this? You’d have to ask them.
But I think they might do it to reduce clutter.
Sometimes, I want to write a good answer to a good question (usually as a thesis-writing deterrence strategy).
 And when I want to write a good answer to a good question, I often turn to the unanswered queue. Writing good answers to already-well-answered questions is, well, duplicated effort. [Worse is writing a good answer to a duplicate question, which is really duplicated effort. The worst is when the older version has the same, maybe an even better answer]. The front page passes by so quickly and so much is answered by really fast gunslingers. But the unanswered queue doesn’t have that problem, and might even lead to me learning something along the way.
In this way, reducing clutter might help Optimize for Pearls, not Sand. [As an aside, having a reasonable, hackable math search engine would also help. It would be downright amazing]
And so I found myself back in The Crusade of Answers chat, reading others’ progress on answering and eliminating the unanswered queue. I thought to myself How many unanswered questions are asked each day? So I wrote a script that updates and ultimately feeds The Crusade of Answers with the number of unanswered questions that day, and the change from the previous day at around 6pm Eastern US time each day.
 I had no idea that 166 more questions were asked than answered on a given day. There are only four sites on the StackExchange network that get 166 questions per day (SO, MathSE, AskUbuntu, and SU, in order from big to small). Just how big are we getting? The rest of this post is all about trying to understand some of our growth through statistics and pretty pictures. See everything else below the fold.
I figure if you’ve made it this far, you’re not afraid of numbers. But before we dive in, I should mention that everything here is taken from the data explorer and the SE Data Dumps. The plots are generated in plot.ly and ported here. The colorscheme is roughly based on the colorscheme of MathSE, with whites, reds, and blues.
Let’s start with the most fundamental aspect: the questions asked.
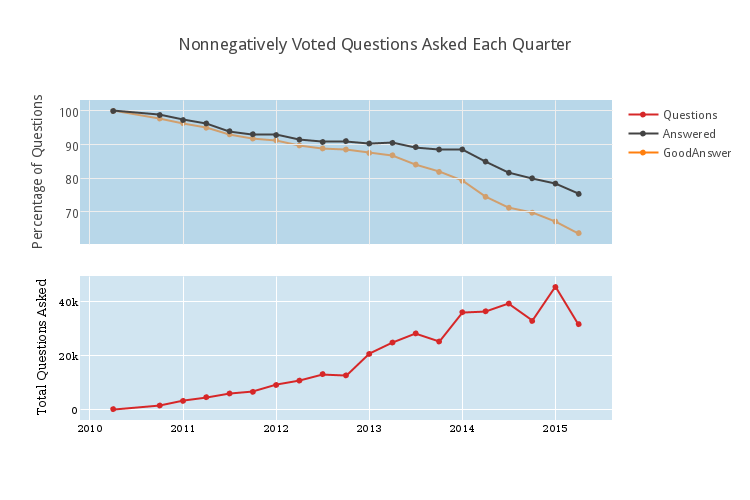 At the bottom is the total number of questions that now have score at least 0 that were asked each quarter. Community-Wiki questions are not included. In the first quarter, exactly 1 question was asked (I’ll assume it was a very important question). Last quarter, about 45000 questions were asked. The dip at the end is because this quarter is still in progress (this will be common). At top is a related graph, indicating the percentage of these questions that are answered (in black) or have answers with score at least 1 (in orange, and mysteriously behind the axis lines). It is extremely important to realize that the top graph is normalized so that the bottom of the axis is at about 65%.
It’s also important to realize that sometimes it takes months for a question to be answered. The questions from 2014 and before have had this time, but the more recent questions haven’t. So the precipitous-looking dip in the percentage of questions with a good answer is a bit “artificially lower” at the end than it should be. It might be reasonable to assume that approximately 75-80 percent of questions with $\geq 0$ votes stand to get upvoted answers. It also seems likely (to me) that a large amount of answered-but-not-positively-answered questions actually have good answers, but they just weren’t upvoted. This is more difficult to classify now. [But not impossible. The Data includes the dates of votes, so we could see how long it takes for posts to get upvoted in general].
If we only look at positively voted questions (Optimize for Pearls, right?), we get the following.
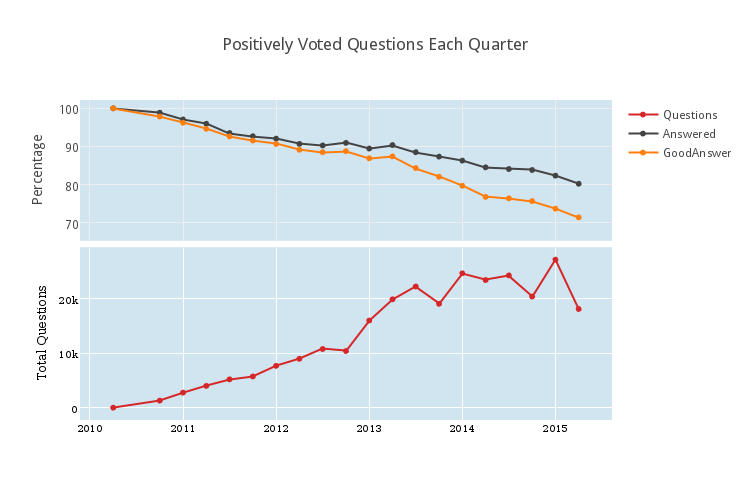 It looks like being positively upvoted corresponds with a roughly 10 percent increase in the probability to receive a “good answer” in the short term, but for questions more than a year old, this pattern doesn’t hold. Perhaps it’s good that so many answerers are willing to help people independently of the score on the question. This is a bit foreign to me, since if I answer a question, I almost always upvote it; my threshold for taking the time to answer someone else’s question is much higher than my threshold to upvote the question. Remember to Vote Early, and Vote Often!
It’s also remarkable that there are so many zero-score questions. There were almost 20000 zero-score questions asked in the first quarter of 2014. This prompts the following question: how has question quality changed over time?
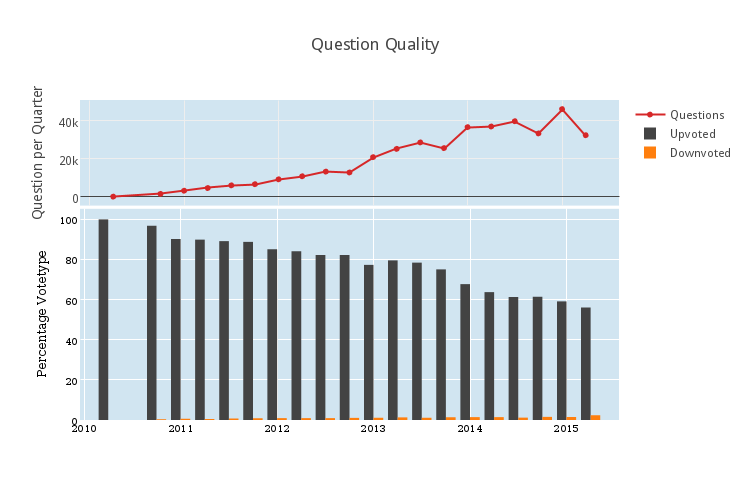
Let’s suppose that a question is “good” if it is upvoted, and a question is ‘bad” if it is downvoted. Then in the plot bar graph above, we see how many good (in black) and how many bad (in orange) questions were asked as a percentage of the total number of questions (repeated in the subplot above). Two major trends are apparent from this plot. Firstly, it’s important to notice what’s not there, which is very many downvoted questions. Is that because no one asks downvoted questions? No. It’s because downvoted questions get closed, and then deleted, and my analysis does not included deleted questions. So if a question is bad enough to get downvoted, it seems it’s usually bad enough to get deleted.
Secondly, more and more questions are receiving fewer and fewer votes. We’re nearing 50% of questions being asked receiving positive vote total. And that’s scary. Is question quality going down? Are fewer users voting?
Let’s look to see if more and more votes are being spent on downvotes. The following plot, very related to the plot above, compares the type of each question vote, that is the total number of upvotes to the total number of downvotes.
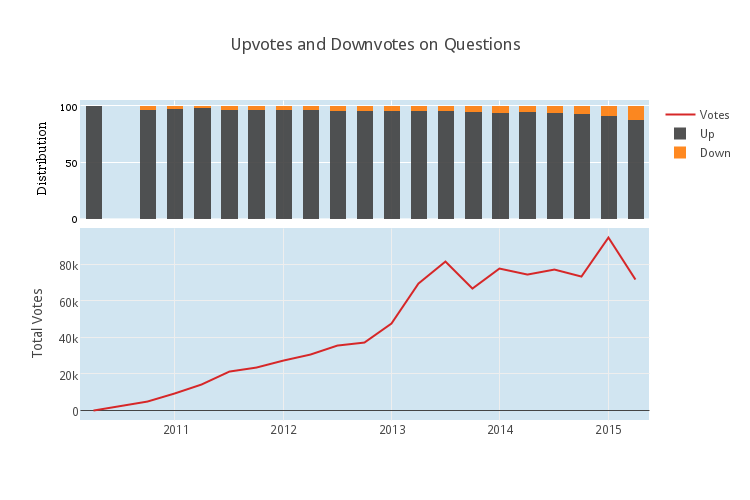
On the bottom, we have the total number of question votes per quarter. Notice, it looks very similar to the number of questions per quarter. This isn’t a surprise. It also looks like the voting distribution is changing only slightly. (Recall that the most recent downvoted posts haven’t yet had the full time to be seen by many people and ultimately get deleted, so there is a slight bias in recent quarters towards downvote. It might be nice to come back in a year and check again to see how this heuristic stands).
On the other hand, it might be a surprise that there are so few votes per question on average.
In fact, I’d go so far as to make the evaluative statement that there are too few votes per question on average, and I would prefer if users both upvoted good posts more and downvoted bad posts more. This would have several positive impacts. Answered-but-not-upvoted questions would fall, it would be easier to find good interesting-but-unanswered questions, and fewer bad questions would stand idly.
How many people ask questions compared to how many people answer questions?
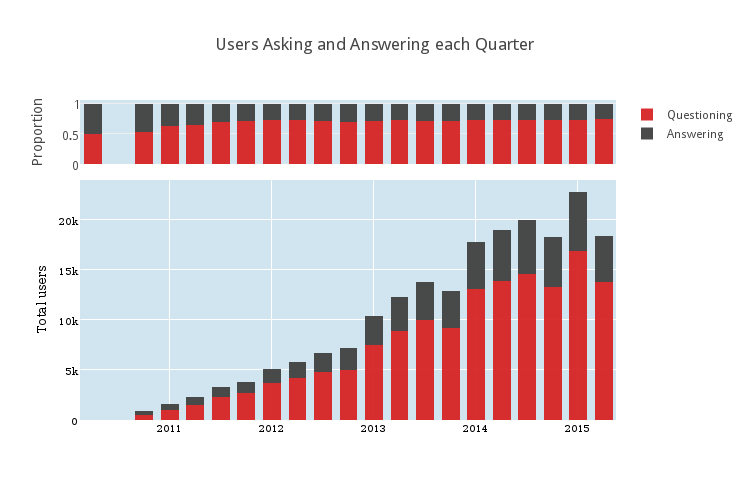 This shows the number of users who answer at least one question in each quarter compared to the number of users who asked at least one question. There were some choices to be made here in presentation. I chose to stack the charts. This makes clear the fact that many, many more people ask questions than answer questions. It’s been about 3 to 1 for the last… well, almost always. The top subplot shows the proportion of the number of question-askers to the number of answer-givers. It’s small because it’s remarkably stationary. Although the numbers are changing, the ratio of 3 question-askers for each answer-giver has been pretty steady for the last 3 years.
Places for more investigation
It would be interesting to follow this up with statistics on how many people ask at least 2 questions in a quarter compared to those that answer at least 2 questions, and so on. It would also be interesting to see if higher and higher voted questions correlate with higher and higher good-answer percentages. There are many avenues for more statistical exploration, but I leave those behind.
As it happens, I’m currently investigating other statistical phenomena through Math.StackExchange. The most interesting project, I think, is something I’m working on with a computational linguist grad student. It’s about designing machine learning processes to automatically understand certain parts of questions and answers. For instance, can we reliably and automatically understand what references are being suggested? A natural follow-up is, can we determine whether different questions are related based on having similar reference-requests? Another similar project is about automatically detecting duplicates in reference-request questions. [We’re looking at reference requests because they should provide an easy starting point. Answers frequently link to the reference, for instance. So if this is very hard, it’s an indicator that we won’t be using machine learning for much more. If it’s totally fine, then we will]. But that’s just in our free time.
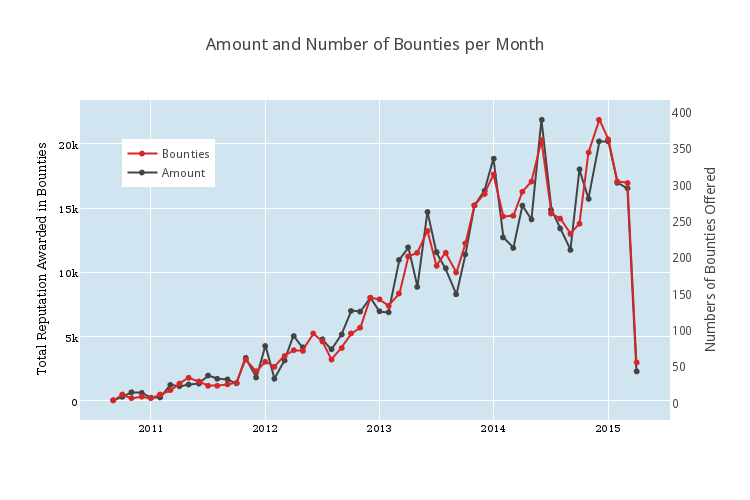
If you’ve made it this far, have a bonus graph. Here are the number (in black) and amount of reputation (in red) of bounties offered each month.
This appears both on the MathStackexchange Community Blog and on the author’s personal website.
Filed under all levels expository
Tagged: data-analysis, meta, statistics
In your evaluative statement you seem to be assuming that all questions can be classified as either “good” or “bad”. Some questions really aren’t either. They’re just boring. There’s no reason to upvote a question that isn’t particularly interesting and there’s no reason to downvote a question that doesn’t break any rules/ standards on Math.SE. So I’d say that many questions shouldn’t be up or downvoted. And in fact as the site gets more popular/ well-known, I’d say the percentage of boring questions will probably rise as students increasingly use this site to help with their homework.
If a question is “boring,” it shouldn’t be kept around. The process in place for that is to downvote and let the autodeleter take care of it.
I’m inclined to agree. Besides, what counts as boring varies enormously from person to person: there are whole areas of mathematics that I find boring (e.g., complex analysis)!
@anorton Maybe you don’t understand what I mean by “boring”. But it would be entirely infeasible to implement a boring-questions-must-be-deleted policy. They make up way too much of the volume of the site AND there’s too much room for opinion about what an “interesting” question is. Example: I “specialize” (I’m actually a physics major, not a mathematician) in Hilbert spaces and operator theory (really QM, but that’s the math I mostly use). Should I downvote any question about matrix arithmetic — even ones where the questioner has put in some effort and I think the concept is one that many students struggle with — just because to me that subject is “old-hat”?
When I’m interested in answering questions, I tend to hang around The Crusade of Answers. I wholeheartedly believe that our site is reaching the point where we will need to take drastic steps to optimize for pearls, or we will cease to be a high quality site.
That aside, I really enjoyed reading this post and thought it was quite informative. In particular, I look forward to hearing some of the results of the project dealing with computational linguistics.
Whether I upvote a question has almost nothing to do with whether I answer it. I am most likely to upvote a question as a reward for providing some constructive thoughts, even if they’re wrong. A very distant second reason is to provide a compensatory upvote when I think that a user has been unreasonably slammed. I have no idea what criteria others use, but in general I see very little correlation between votes on questions and anything that I can recognize as quality. I think that little if anything would be lost if questions were not subject to voting at all. (Note, however, that under the present system I do make a genuine effort to vote on them: 42% of my votes are on questions.)
In contrast, it appears to me that there is something vaguely (albeit sometimes very vaguely) resembling a consensus when it comes to voting on answers, apart from the vandals who downvote correct, usable answers on ideological grounds. My own judgements are often rather different, but the voting that I see on answers does seem to have a positive correlation with quality. (This can’t be pushed too far, of course: different types of questions have audiences of different types and sizes.)
I do not mean to imply that I only vote on questions that I answer. I vote frequently. What I was trying to get at is that if I don’t think a question deserves an upvote, then I won’t answer it either. So not if and only if — just a one-sided implication.
I agree that question quality and votes are poorly correlated. I might be biased, because I’m typically more interested in less approachable problems. Selection bias leads to their votes being less meaningful, I think.
Within a question, I think that votes do a pretty good job correlating with quality. But I think that great answers to less approachable problems are also doomed to fewer votes.
Thanks for the detailed analysis. At a glance I do find the increase in unanswered question a bit worrisome. I only hope the efforts to moderate the site will continue and they will not be stifled too much by a group of some vocal users with an at times cavalier attitude towards the rules of the site.
The most vocal users, especially on Meta, are those with a rather narrow and often mathematically elitist view of what is appropriate, many of whom confuse their preferences with the rules of the site. Their efforts to moderate the site frequently end up imposing their prejudices on other users and not infrequently verge on bullying newcomers, especially those with elementary questions. And the campaign begun about a year ago by The Man of Many Names has resulted in out and out vandalism. We could do with a good deal less of this ‘moderation’.
(It seems one cannot reply to a reply; this is intend as reply B.M.S.)
Whether you like it or not some things are rules, not only my personal preferences. These include: one must not flat-outright insult or denigrate other users (in any case not as standard form of communication), one must not vote in spite, one must not cheat with votes in other ways, etc.
I would already be happy just this would be follow. It should not be that hard; still several highly active users fail at some of it. (Granted “vocal” was perhaps not the most fitting adjective.)
Remember that down votes questions without answers get auto deleted based on their age. Therefore it will always look like newer questions are worse then older questions.